
Hospitality loves a divisor. Hotels compress entire developments into cost per key: total project cost divided by room count. Restaurants do the same with cost per seat, and sometimes cost per square foot. The appeal is obvious: one number that lets a lender compare projects, a developer sanity-check a budget, an owner brag or wince at a conference. And the numbers are genuinely useful, inside their limits, which almost nobody quotes alongside them.
This is a Budget Desk piece about those limits. Not because the ratios are wrong, but because they are shorthand, and shorthand read as arithmetic has sunk real budgets. We have watched owners reverse-engineer an entire project budget from a per-seat figure heard at a trade show, and we would like to talk you out of it.
What the ratios are actually for
Used properly, unit-cost metrics do three jobs well. Screening: early in feasibility, before drawings exist, a per-key or per-seat range, sourced from your own market, your own tier, your own year, brackets whether a concept is even worth designing. Comparison: across projects of genuinely similar type, vintage, and market, the ratio surfaces outliers worth investigating. Communication: lenders and investors think in these units, and a pro forma that speaks them fluently reads as literate. Development-cost surveys published by hotel consultancies and industry bodies exist precisely for this screening tier: as ranges, with definitions attached, which is exactly how they should travel.
The trouble starts when the shorthand gets promoted from screening tool to budget. So: the five ways the ratios lie.

Lie one: nobody agrees what is in the numerator
Cost per key of what, exactly? Land or no land? Soft costs: design, permits, financing, insurance? Pre-opening costs and working capital? The FF&E package, which in a hotel is enormous? Two developers can quote per-key figures for near-identical buildings that differ by a third, both honestly, because their numerators contain different projects. Every published survey defines its buckets; every conference anecdote does not. The first question to ask of any unit cost is what is included, and if the speaker cannot answer, the number is a mood, not a metric.

Lie two: the denominator is a design choice
Keys and seats are not fixed properties of a building; they are decisions. A restaurateur can add twenty seats to the same fit-out by shrinking the bar and tightening the floor plan. The per-seat cost just "improved" while the guest experience, the service model, and possibly the fire-code math all changed. Hotels do the same with room mix: smaller rooms, more keys, better ratio, different hotel. When a unit cost is the target, the denominator becomes the temptation, and projects have quietly degraded their own concepts to flatter a spreadsheet. The ratio was supposed to measure the design. Handled carelessly, it starts to drive the design.

Lie three: fixed costs do not care how many seats you have
A build-out is full of costs that arrive in lumps regardless of scale. The kitchen hood and its fire suppression, the grease interceptor, the electrical service upgrade, the accessibility work, the permit-and-inspection months. A sixty-seat restaurant and a hundred-twenty-seat restaurant can carry nearly the same bill for all of them. Small venues therefore carry brutal per-seat numbers, not because they are badly managed but because arithmetic works that way. Comparing a forty-seat wine bar's per-seat cost to a two-hundred-seat brewpub's tells you mostly that division happened. The fixed-lump structure also means per-unit costs fall with scale in ways that say nothing about efficiency: a flattering trap for big projects and a slander on small ones.

Lie four: vintage and geography travel badly
Construction costs move: with material markets, labor markets, code cycles, and the general drift that construction cost indices exist to track. A per-key figure from a project bought out three years ago describes a different market than the one your bids will arrive in; a figure from another metro describes a different labor pool, permit regime, and seismic-or-snow-load code reality. Unit costs age like produce, and they do not ship. The only ratios worth calibrating against are recent, local, and defined, which usually means paying for the current survey data or, better, asking contractors to rough-order-of-magnitude your actual drawings.
Lie five: the ratio hides the phase that kills you
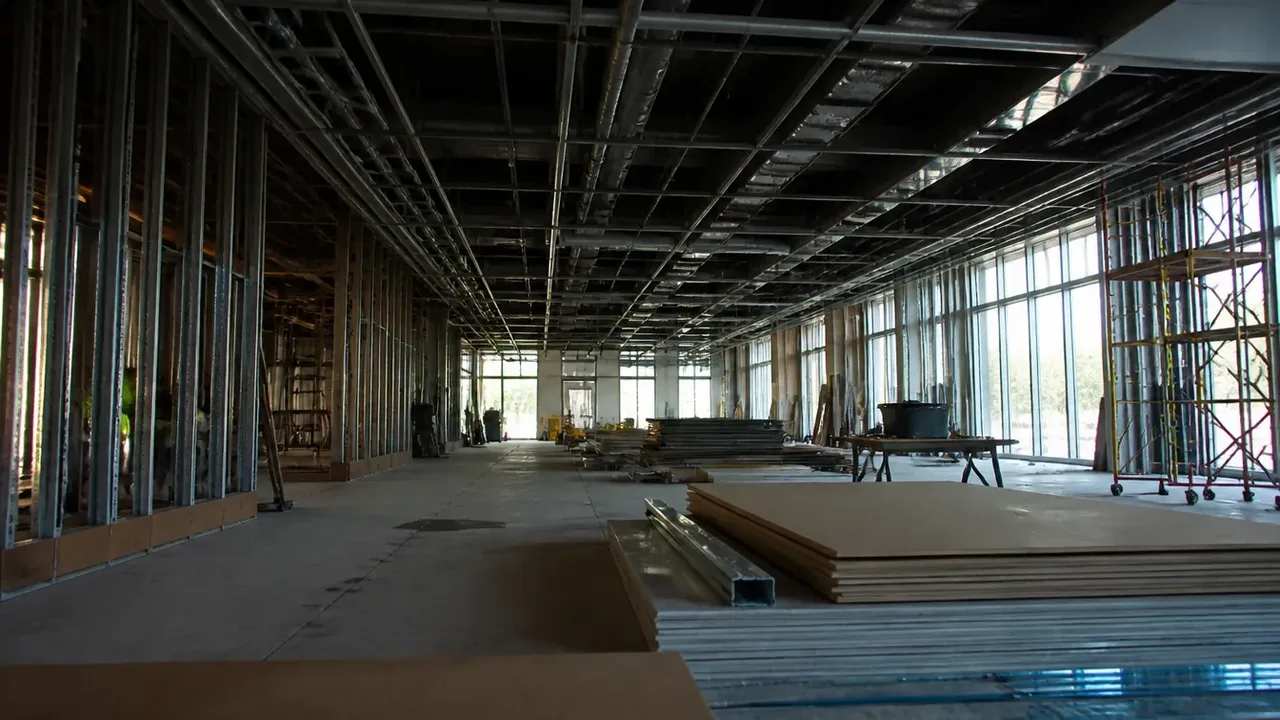
Per-key and per-seat numbers aggregate the whole project into one figure, which means they conceal the internal structure where projects actually fail. That structure includes the split between hard costs, soft costs, FF&E, and contingency; the cash-flow timing that draw schedules impose; and the change-order drift that accumulates after buyout. A project can match its target ratio at completion and still have died twice of illiquidity along the way. The ratio is a photograph of the finish line. Budgets are managed in the race.
Handling instructions
Compressed to a use-guide: quote ranges, never points, and attach the definition every time. Use unit costs to screen concepts and compare likes, never to set budgets. Budgets get built bottom-up from scope, the way our budget framework lays out, and then reconciled against the ratio as a sanity check, in that order. Distrust any figure that has crossed a border, a market tier, or more than two years. Ask what is in the numerator; watch for games in the denominator. And when your own project's ratio comes out ugly against the conference number, investigate before you panic. The usual finding is not waste but arithmetic: a small denominator, an honest numerator, and a fixed-cost lump the big projects amortize invisibly.
The per-key and per-seat figures will follow you through every lender meeting and every industry conversation of the project. Learn to speak them fluently, quote them responsibly, and never, not once, let the shorthand write the budget it was only ever meant to summarize.
For the restaurant furniture portion, build the estimate item by item with Restaurant Opening Guide's furniture cost guide, keeping that subtotal separate from the full fit-out budget.
A worked scope reconciliation
Before comparing cost per key, make the numerator visible. Here is an illustrative 40-room conversion with an $8 million project budget. These are invented planning inputs, not current market rates or an HVS benchmark.
- Building acquisition: $2,000,000
- Construction and building systems: $4,000,000
- Design, permits, finance and other soft costs: $900,000
- FF&E: $700,000
- Preopening costs and working capital: $400,000
- Total: $8,000,000
Three statements can now describe the same project:
- Total project cost: $8,000,000 ÷ 40 = $200,000 per key.
- Cost excluding acquisition: $6,000,000 ÷ 40 = $150,000 per key.
- FF&E alone: $700,000 ÷ 40 = $17,500 per key.
None is interchangeable with the others. If another owner quotes $150,000 per key, establish its scope before deciding that their project costs 25% less. The apparent difference may be entirely the acquisition line.
Record the source year separately from the publication year. The HVS 2026 survey uses project budgets from the 2025 calendar year and explains that costs depend on the projects and locations in its dataset. It cautions against using the survey to determine an individual project's cost. HVS U.S. Hotel Development Cost Survey 2026
Finish the comparison with a short reconciliation note: included categories, room count, property type, geography, data year and unresolved differences. Do not apply an invented national inflation or conversion factor to make two unlike projects appear comparable. Use the comparison to identify questions for the bottom-up budget.
Keep a private, dated log of useful comparison costs, with each entry's source, data year, market and inclusions. A figure supported by comparable bids can inform a screening range; build the project budget from its own scope, drawings and quotations.